-
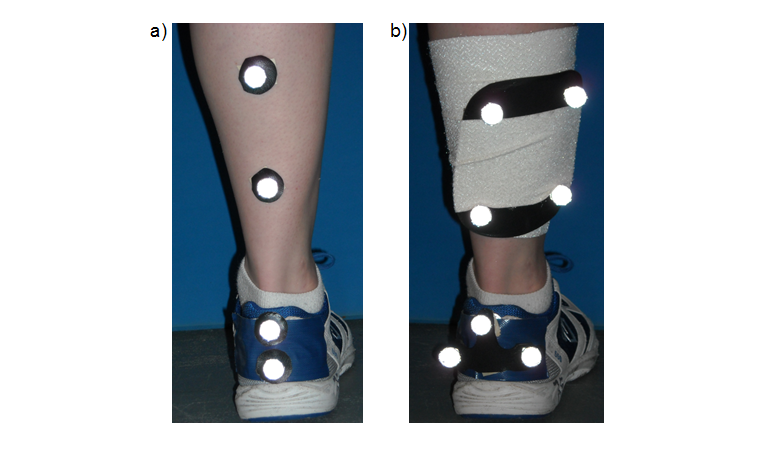
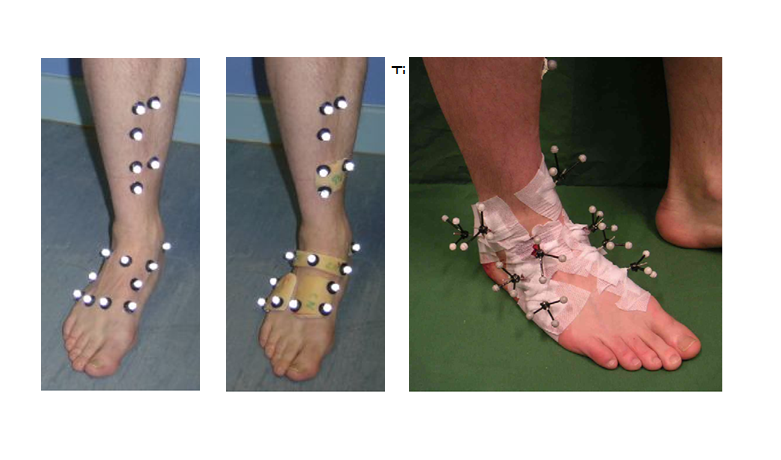
 Figure 21.1Marker placement for: a) 2-dimensional rearfoot analysis; and b) 3--dimensional rearfoot analysis. In a 2-D marker arrangement only 2 markers per segment are required whereas at least three non-collinear markers are required for a 3-D set-up.
 -
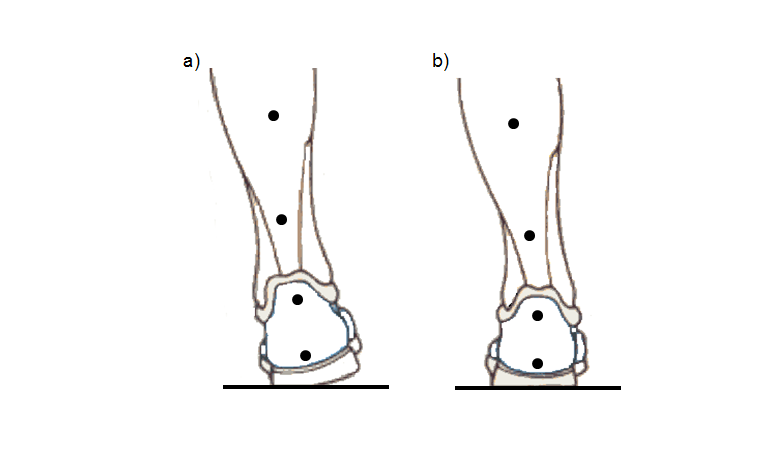
 Figure 21.2Rearfoot position for a left foot contact at: a) touchdown (the rearfoot is slightly supinated); and b) maximum rearfoot eversion (the rearfoot is maximally everted). The black dots refer to the positions of markers in a 2-dimensional marker placement.
 -
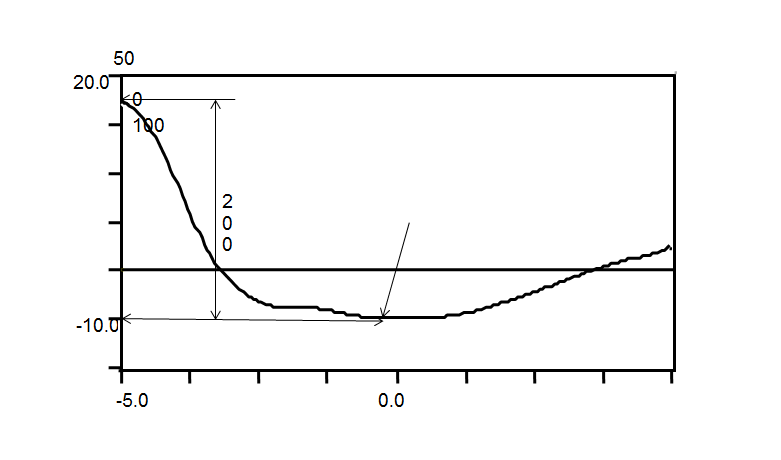
 Figure 21.3An exemplar rearfoot angle profile illustrating the parameters normally used in footwear evaluation: a) rearfoot angle at touchdown; b) maximum rearfoot angle; c) time to maximum rearfoot angle; and d) total range of motion.
 -
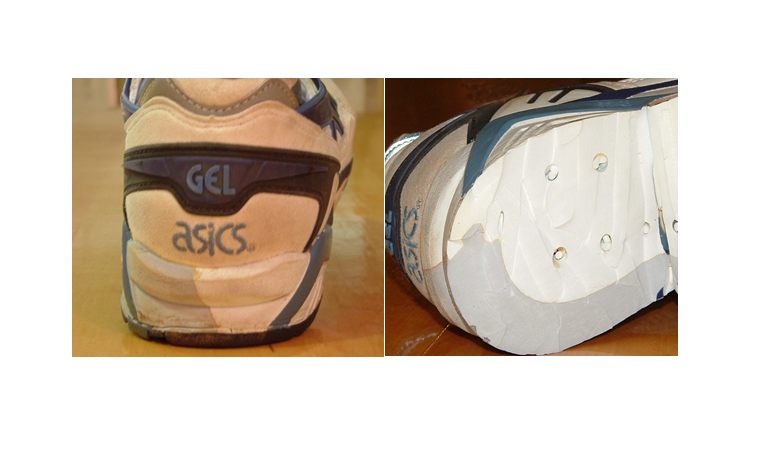
 Figure 21.4The dual density midsole of the ASICS Epirus, a running shoe developed in the 1980’s. In this example of a right shoe, the softer (white) material is on the Lateral border while the firmer (gray) material is on the medial border.
 -
 Figure 21.5Marker arrangement using: a) skin mounted markers; b) markers mounted on plates; and c) markers on bone pins inserted into nine bones. Reprinted with permission from Nester, C., R.K. Jones, A. Liu, D. Howard, A. Lunberg, A. Arndt, P. Lundgren, A. Stacoff, P. Wolf. (2007). Foot kinematics during walking measured using bone and surface mounted markers. Journal of Biomechanics 40:3412-3423.
 -
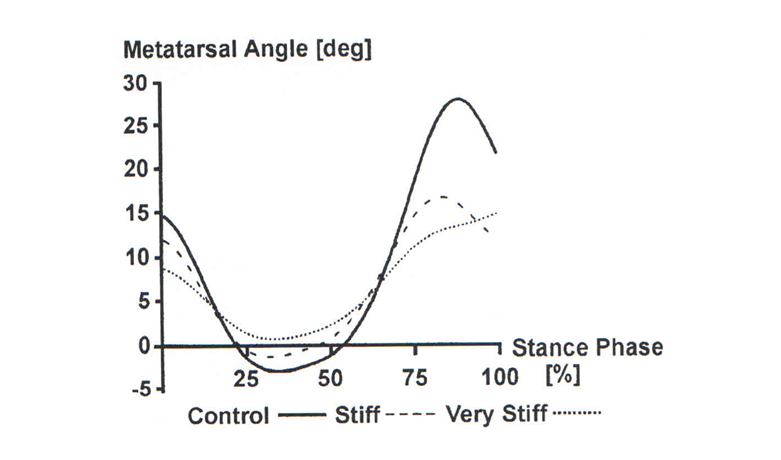
 Figure 21.6Metatarsal angle during the stance phase for a typical running subject while wearing shoes of different stiffness. Reprinted with permission from Stefanyshyn, D.J. and B.M. Nigg. 2000. Influence of midsole bending stiffness on joint energy and jump height performance. Medicine and Science in Sports and Exercise 32(2):471-476.
 -
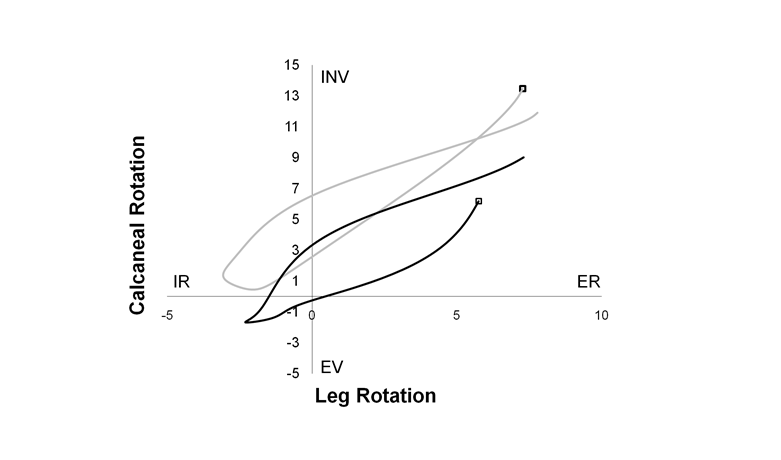
 Figure 21.7Angle–angle plot of frontal plan calcaneal inversion (INV) and eversion (ER) and transverse plane tibial internal rotation (IR) and external rotation (ER) during rearfoot (black line) and forefoot (grey line) running footfall patterns. Data represent the mean of a sample of runners participating in a study at the University of Massachusetts Amherst.
 -
 Figure 21.8Timing relationship between the maximum rearfoot angle (maximum eversion) and maximum knee flexion in shoes of different midsole firmness. There was a significant difference in the timing only in the softest midsole. Reprinted with permission from Hamill, J., B.T. Bates, K.G. Holt. 1992. Timing of lower extremity joint actions during treadmill running. Medicine and Science in Sports and Exercise 24(7):607-813.
 -
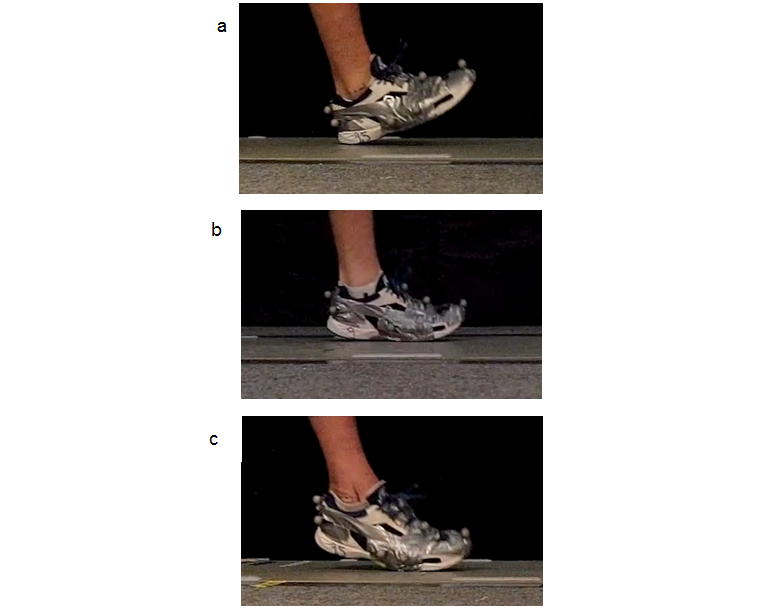
 Figure 21.9Footfall patterns exhibited in human running are categorized by the point of initial contact made between the foot and surface: A) rearfoot; B) midfoot; C) forefoot.
 -
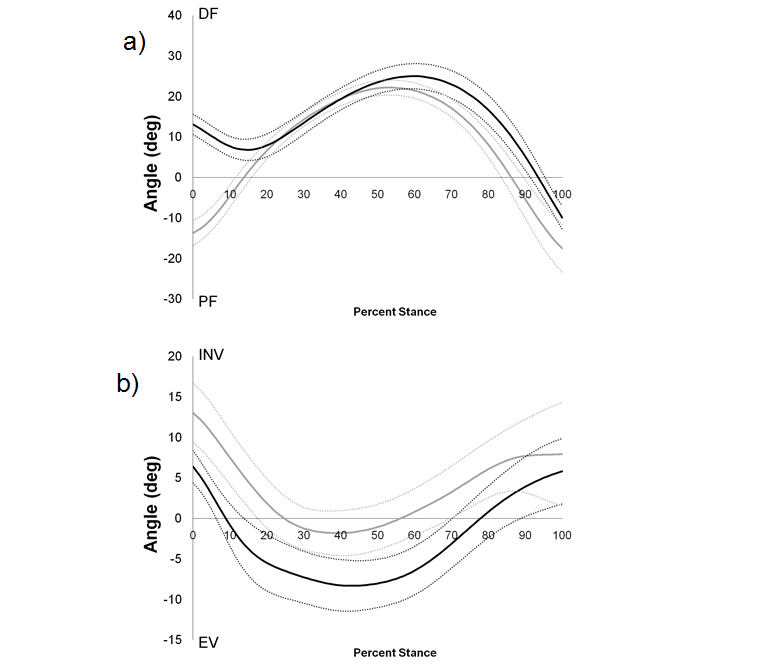
 Figure 21.10Mean ± SD ankle joint kinematics of the rearfoot (black line) and forefoot (gray line) footfall patterns during the stance phase of running for the a) sagittal; and b) frontal planes. Data represent the mean of a sample of runners participating in a study at the University of Massachusetts Amherst.