-
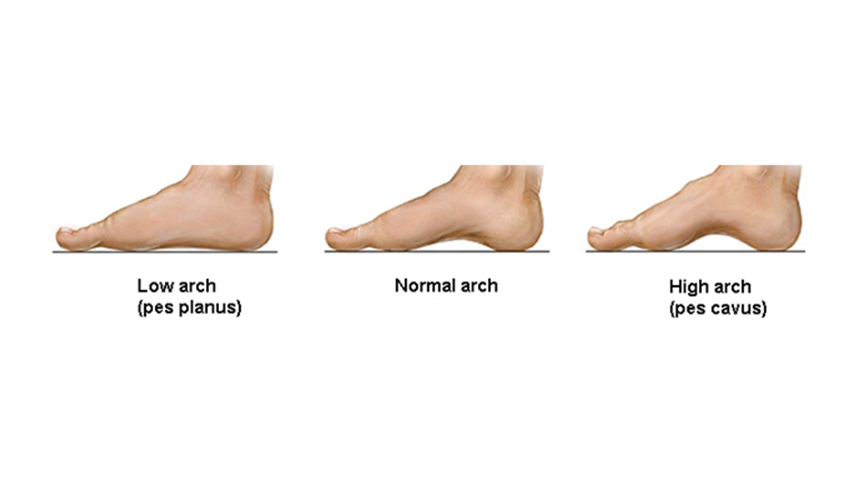
 Figure 3.4Low, normal and high arched type feet.
 -
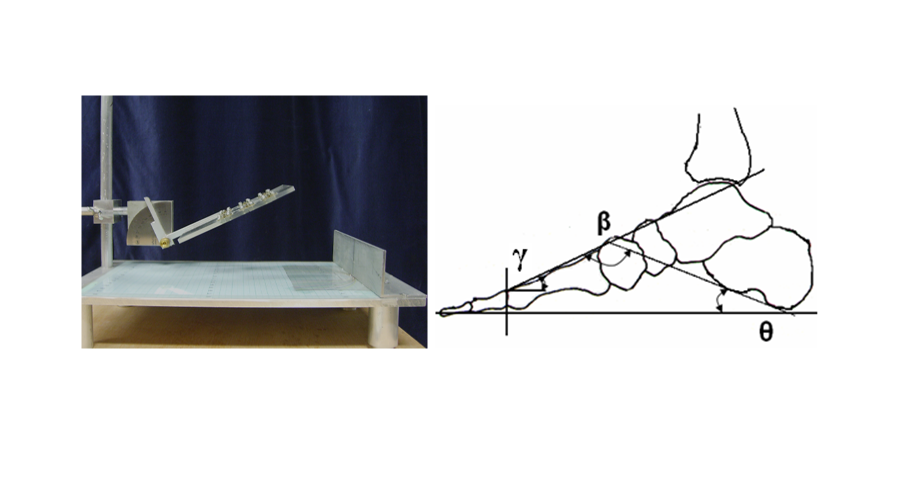
 Figure 3.5Jig for measuring midfoot dorsal angle (γ) and its representation (Adapted from Xiong et al., 2010 with kind permission from JAPMA)
 -
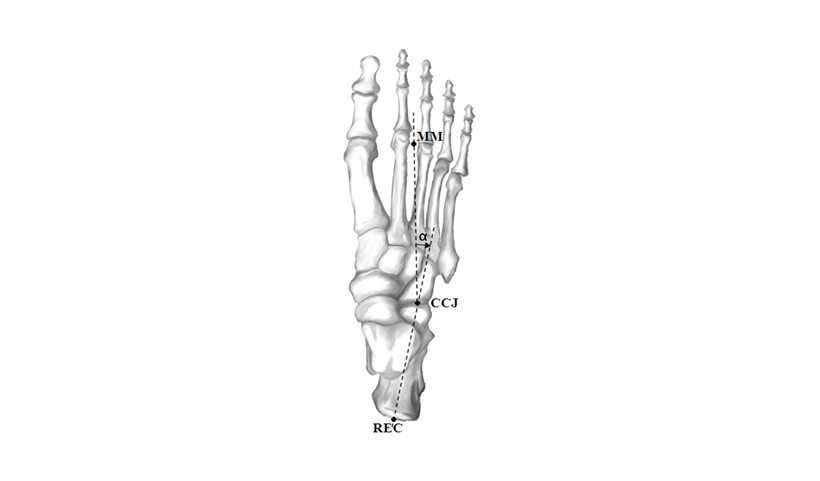
 Figure 3.6Forefoot-rearfoot angle from foot radiograph (Reproduced and adapted from Figure 4A in Razeghi and Batt, 2002 with permission from Elsevier)
 -
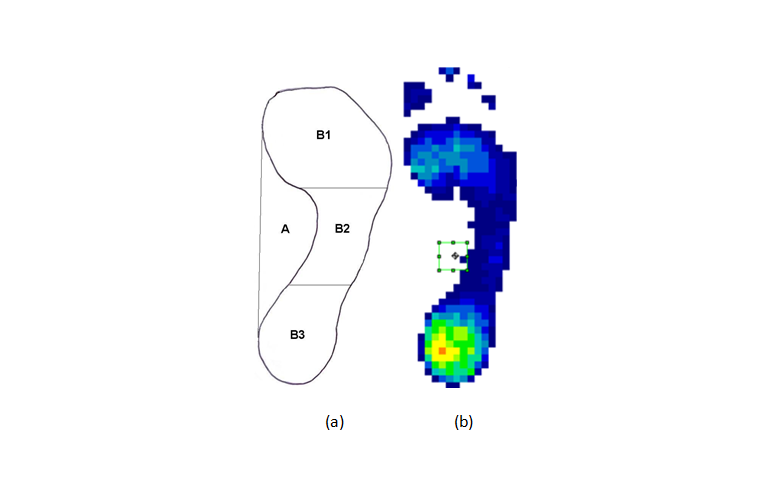
 Figure 3.7Illustration of arch-related parameters (Arch index =B2/(B1+B2+B3), footprint index=A/(B1+B2+B3)) from a traditional inked footprint (a) and a sample of the electronic footprint (b)
 -
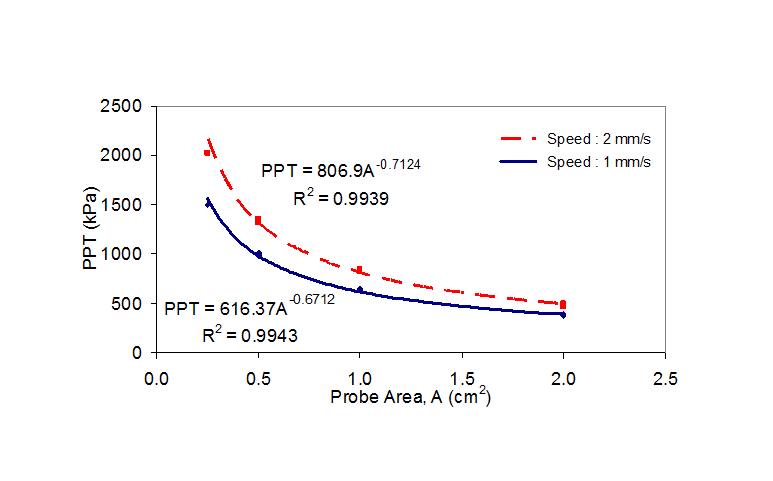
 Figure 3.13Variation of PPT on heel with probe area and indentation speed.
 -
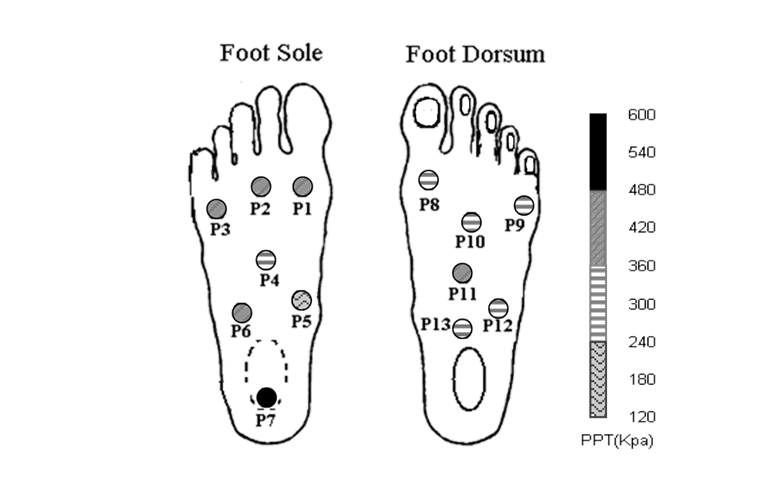
 Figure 3.14PPT variation across foot
 -
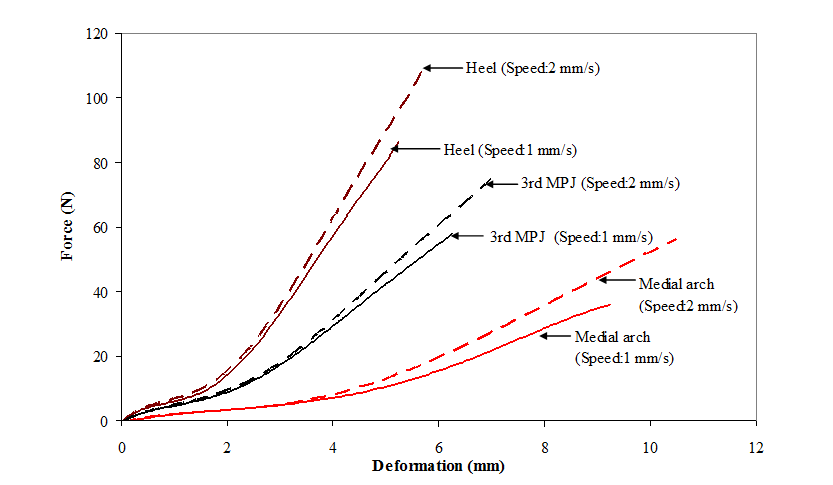
 Figure 3.18Illustration of typical tissue deformation pattern on plantar foot
 -
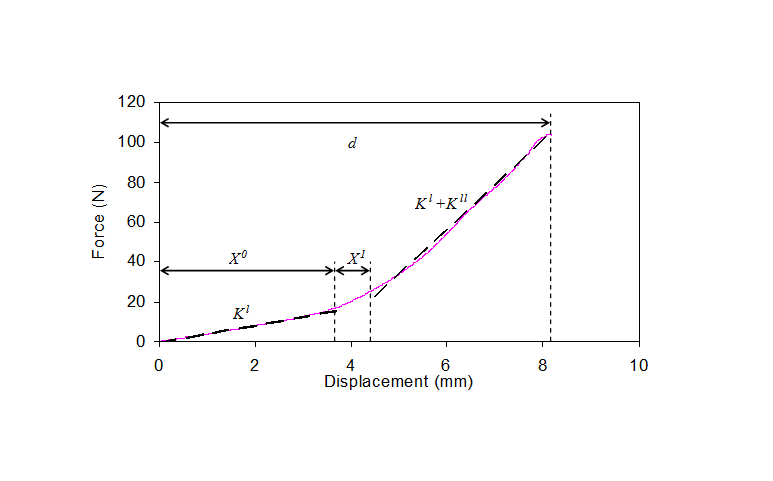
 Figure 3.19Representation of revised model parameters on force-deformation curve.