-
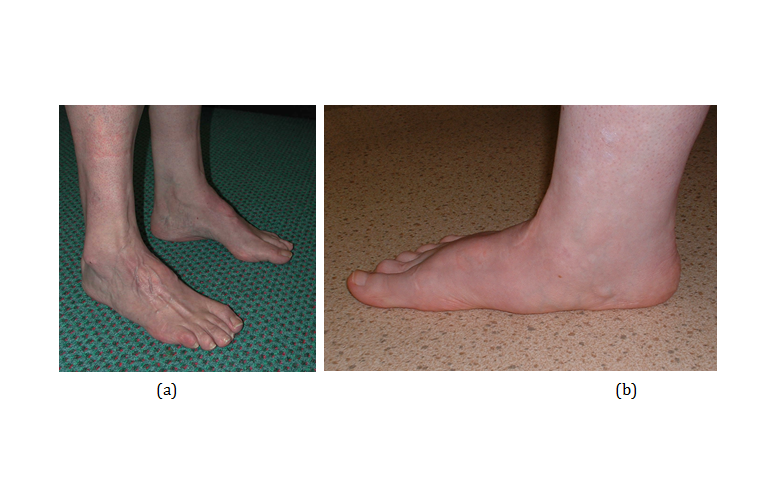
 Figure 4.1Frank cavus and pes planus foot deformities, in both cases associated with systemic conditions (Charcot-Marie-Tooth disease and systemic joint hypermobility). After Redmond 2102 and reproduced with the kind permission of the Royal College of General Practitioners of England.
 -
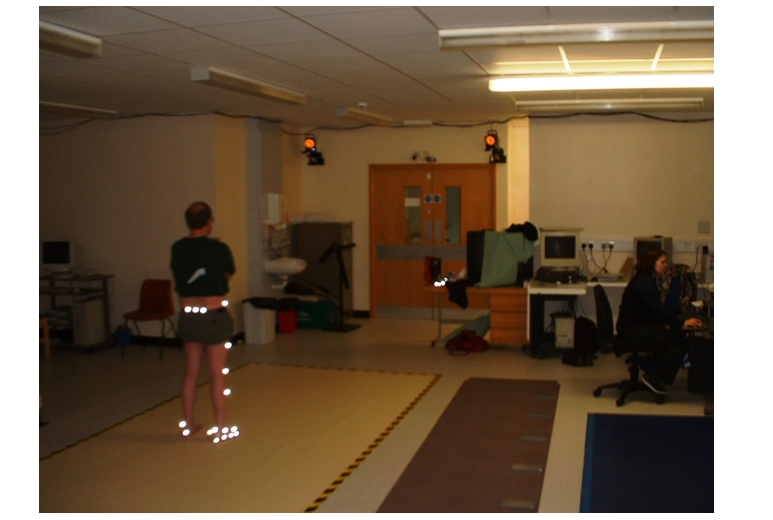
 Figure 4.2Laboratory assessment of lower limb structure and function. The subject is wearing the marker set for evaluation using the Vicon Oxford multisegment foot model.
 -
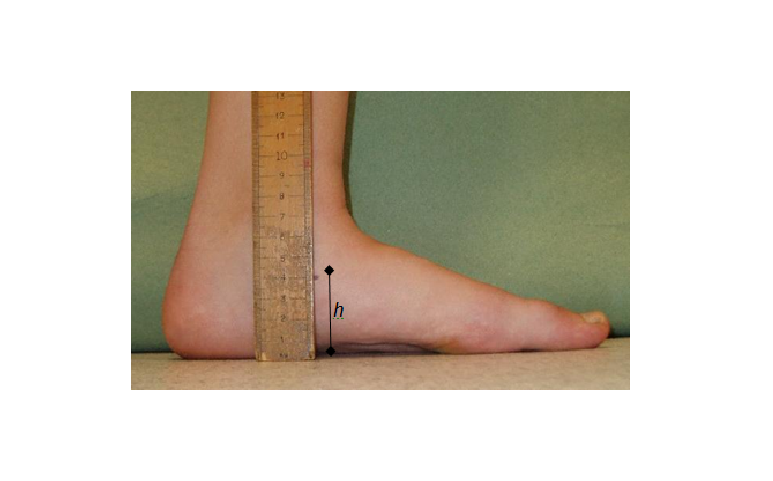
 Figure 4.3Measurement of navicular height (after Redmond, 2008). (Reproduced with permission of Churchill Livingstone)
 -
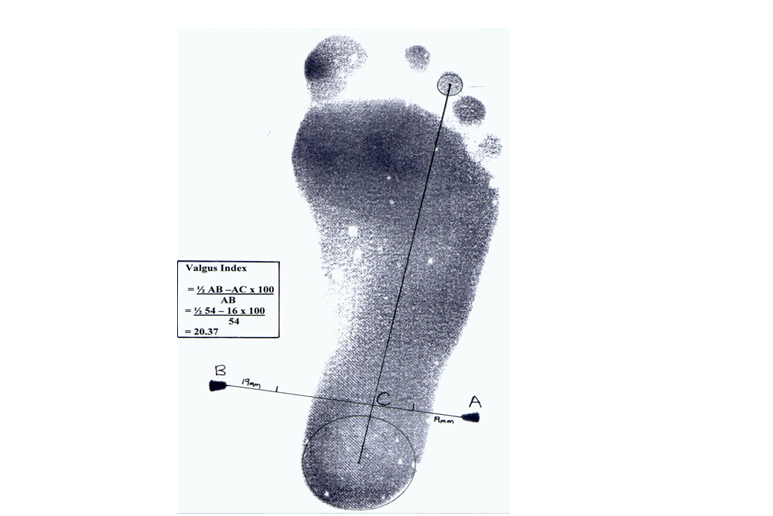
 Figure 4.4Valgus index calculation derived from an inked footprint (Burns 2005, reproduced with permission of the Journal of the American Podiatric Medical Association)
 -
 Figure 4.5The cover of the FPI-6 Manual (Reproduced with permission http://www.leeds.ac.uk/medicine/FASTER/fpi.htm. All rights reserved).
 -
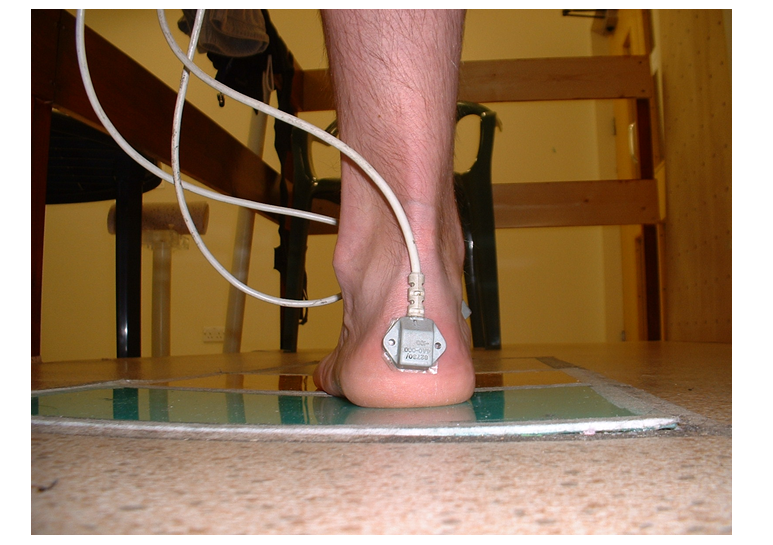
 Figure 4.6The setup used for capturing posture and function using electromagnetic motion tracking (note the sensors were covered tightly in conforming tape for the trials to minimize skin movement artifact).
 -
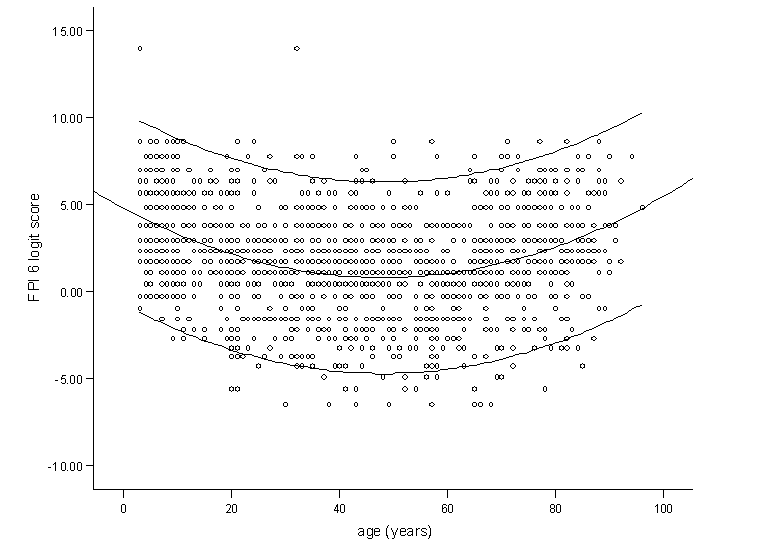
 Figure 4.7Scatterplot of FPI scores according to age showing the tendency toward a more pronated foot posture in children and older adults.
(after Redmond (2008) and reproduced under the terms of the BiomedCentral Creative Commons Attribution License). -
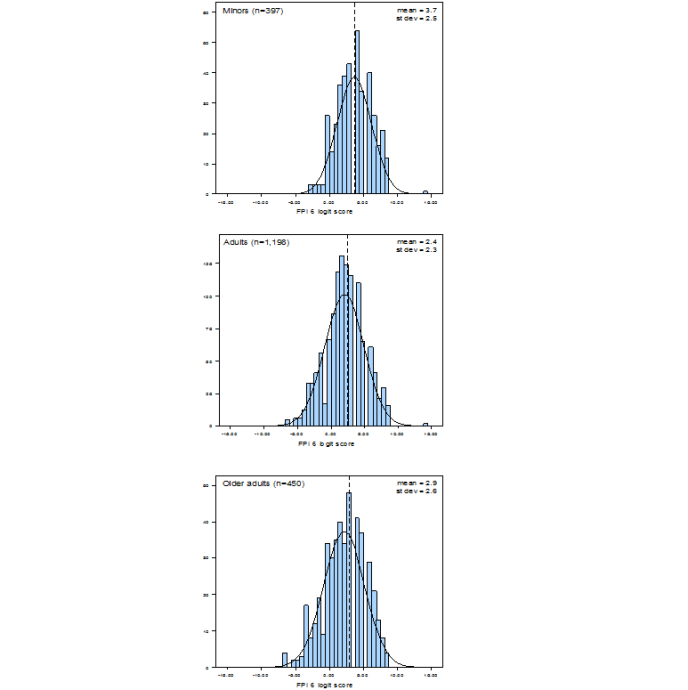
 Figure 4.8Histograms of FPI scores for minors, adults and older adults. Dashed lines represent means.
(after Redmond (2008) and reproduced under the terms of the BiomedCentral Creative Commons Attribution License). -
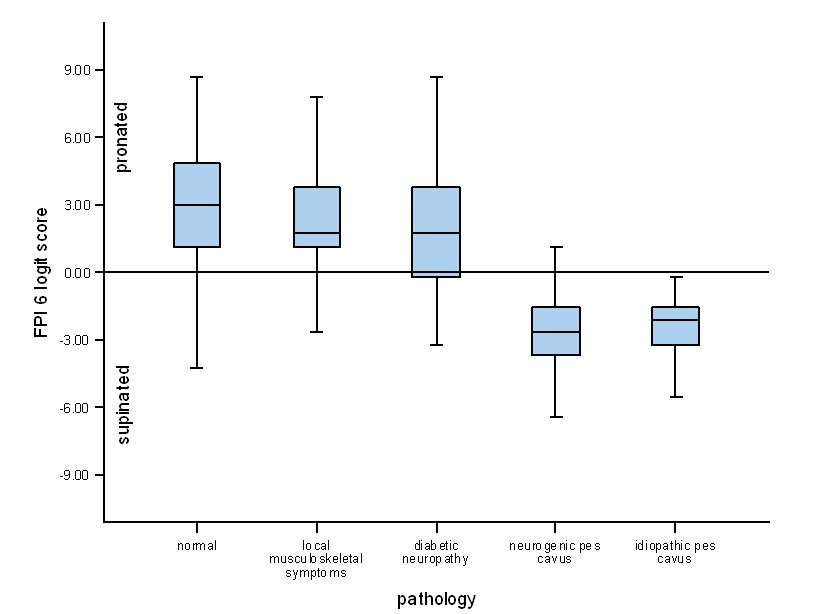
 Figure 4.9Boxplots of FPI scores according to presence of pathology. Error bars are 95% confidence intervals and horizontal lines represent medians.
(after Redmond (2008) and reproduced under the terms of the BiomedCentral Creative Commons Attribution License).